MyWraps

MyWraps is the powerful ExcelWraps reporting system. It creates a filtered and sorted list of Wraps in the form of tables and can visualize information in charts. Users with sufficient permissions can define and save bespoke reports and manage wraps using a filtered list. Developers can feed filtered and aggregated wrap data into other wraps using the MyWraps2 function.

MyWraps displays cell values in selected Wraps as charts or tables. Reports can be filtered, sorted, and ordered to give users exactly the information they require. Aggregation functions allow you to define sums, averages, and other calculations across the whole data set.

MyWraps reports and wrap data can be imported into Excel for advanced analysis.

MyWraps can be called from inside a wrap with the MyWraps2 function. This enables wraps to read also large amounts of data from other wraps, and to include wrap data in tabular format using the ShowTable function.

The fine granularity of the MyWraps filtering system makes it useful for users with sufficient permissions to perform some wrapsite maintenance from inside MyWraps, e.g. to print, recalculate, freeze, export, or delete wraps.

MyWraps help pages

These are the help pages that document the MyWraps reporting functionality:

  • Overview: how to use MyWraps interactively – An introduction to the MyWraps user interface. This describes how you create ad hoc reports. Users with sufficient permissions can create a bespoke report and save the report link for later reuse.
  • Overview: MyWraps links and their parameters – Each MyWraps report is essentially a link. Users with sufficient permissions can save the link and use it to regenerate the report. The format of this link and its possible parameters are described in detail.
  • Filter a list of wraps – There are many ways to filter a list of wraps, and a number of operators like “equal to” or “greater than” that you will find useful.
  • MyWraps data types – This contains a reference listing of all the data types and signature properties in MyWraps.
  • Report pagination and MaxRows – Reports can be paginated using the pageSize parameter. You can request only a single page using the page parameter. MyWraps reports are limited to 500 wraps by default, to ensure a reasonable response from the server. This limit may be increased or removed with the MaxRows parameter in the link to the report.
  • MyWraps Report Setup – Users with sufficient permissions can use the Setup, Sort and Aggregate buttons in MyWraps to define a report, its columns, and any appended wraps.
  • MyWraps charts – Users with sufficient permissions can define the chart used to visualize a MyWraps report.
  • Add a MyWraps report to your Wrapsite – You can add a useful MyWraps report to your Wrapsite, making it easy for your users to use the report.
  • Actions – Users with sufficient permissions can perform several administrative functions directly inside MyWraps, e.g. Print wraps to PDF, Recalculate wraps, Freeze wraps without signing them, Export wraps to a local file, and Delete wraps.
  • Use Excel to analyze wrap data – Importing wrap data into Excel makes it easier to analyze large amounts of data.
  • Use the MyWraps2 function to read wrap data into other wraps – Using the MyWraps2 function, developers can request a single data extract containing all the data they need for a dashboard or a table inside another wrap.
  • Functions for developers – Two helpful Copy functions help you create MyWraps2 function calls and provide data for testing.
  • Track MyWraps in the Audit trail – all MyWraps requests can be logged in the Audit Trail.

Select the wrap template

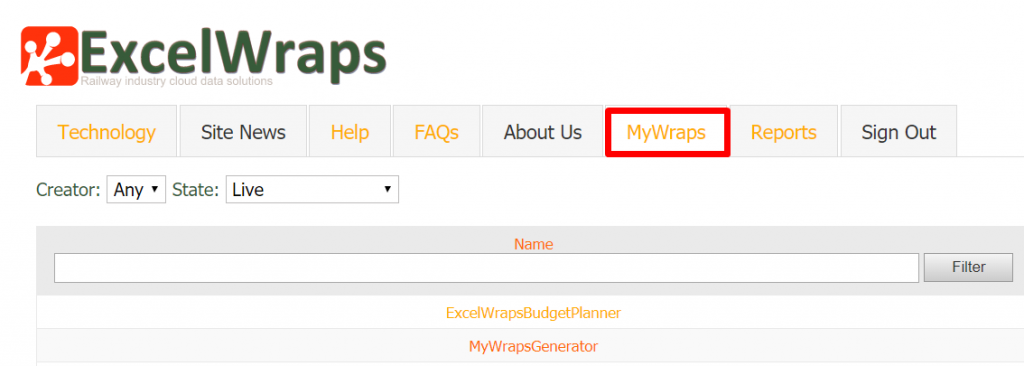
MyWraps is located on a separate tab on the start page of your Wrapsite. Navigating to MyWraps will present a list of the Wrap templates that are available to you.

Your access to data is governed by the ExcelWraps permissions model. If you don’t see a certain wrap template in the list, contact your wrapsite administrator or client services.

Screenshot of the MyWraps tab on the start page of a Wrapsite

Filter the list of wrap templates

The Creator filter allows you to view only the Wrap templates that are created by Me (the logged-in user) or Any (created by anyone). Read more in the help for the Creator filter.

The State filter lets you select only the wraps that are Live or Frozen, awaiting a signature or signed by you. Read more in the help for the State filter.

You can also filter the list by entering any part of the Wrap’s name in the Name text box and press Filter.

Select the wrap template

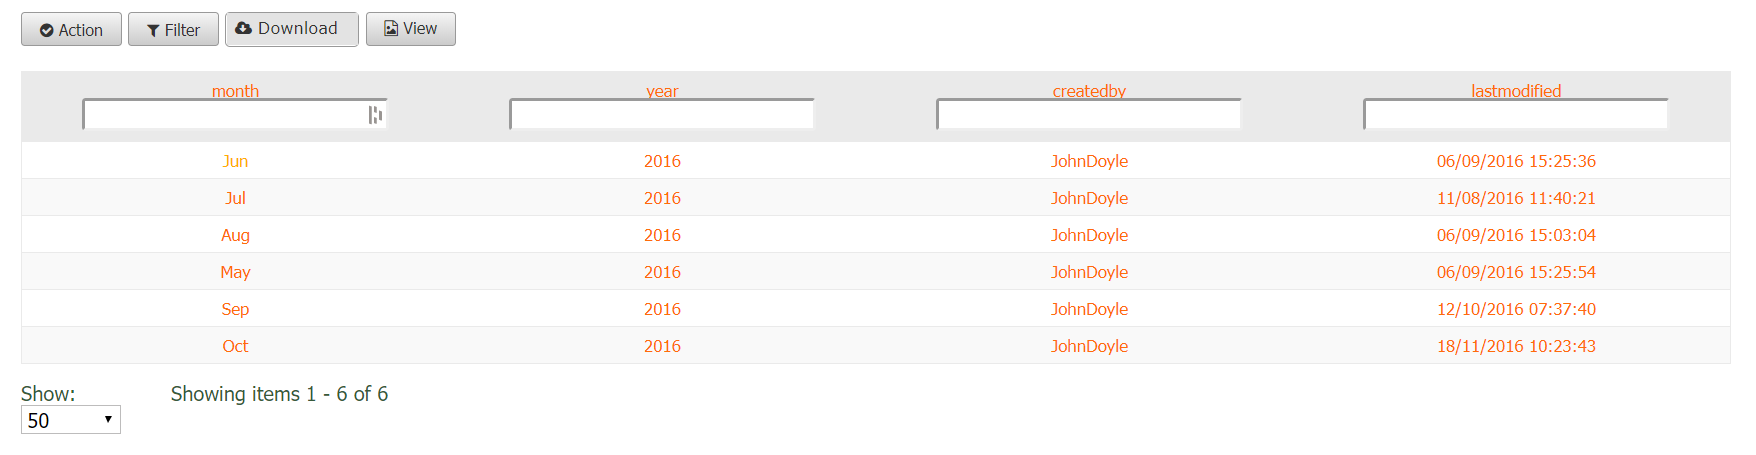
Click on the wrap template you want a report from. A list of its wraps appears. Each row represents one saved wrap. You can open any of the wraps by clicking on its row.

When you open a saved wrap, it normally contains the most recently saved values. If formulas in the wrap template have been changed, the wrap may require recalculation, which is performed automatically before the data is used in the report.

Screenshot of all instances of a Wrap in MyWraps

Access denied vs empty table

MyWraps operates under the ExcelWraps permissions model.

  • If your Roles don’t grant you at least read access to a Wrap, you won’t be able to view reports based on the Wrap either. In this case, you will get an Access Denied error when you try to open the Wrap in MyWraps.
  • If your Roles do grant you at least read access to a Wrap, but the Wrap does not belong to your Workgroup or a Workgroup trusted by your workgroup, the list of wraps may be empty.  This is because it is possible for individual wraps to be trusted to your workgroup, but at the moment there aren’t any such workgroup trusts.

Format the report

Filter the list of wraps

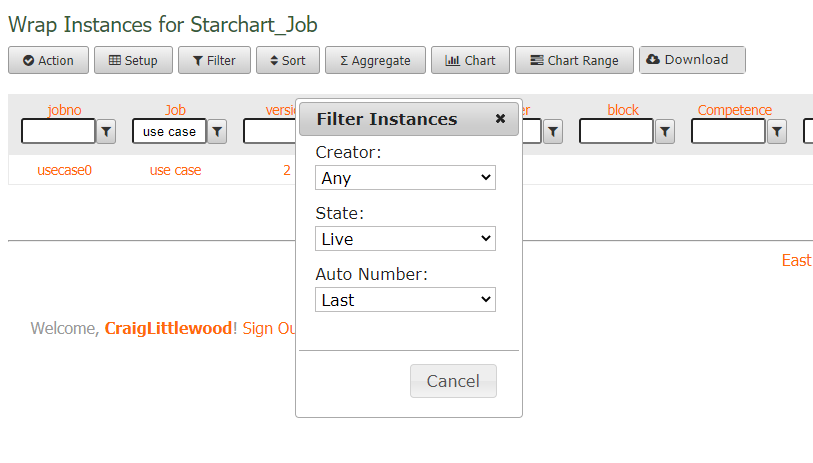
Use the Filter button to filter wraps on Creator, State, and Auto number. Use the search boxes at the top of each column to focus on wraps with certain values. Click on the “filter” symbol in each filter field for help. Learn more about how to filter the list of wraps.

Screenshot of the dialog used to filter instances in MyWraps

Use the toolbar to work with the wraps

The buttons in the toolbar allow you to perform additional operations on the wraps in the list.

For an ordinary user, these buttons appear:

  • Action = Brings up the list of actions that you can perform on all or selected wraps (create new, download, recalculate, etc). Some actions only appear if you have a Role with sufficient permission. Some actions are deactivated until you select at least one wrap in the list. For more information, visit the MyWraps actions help page.
  • Filter = Brings up the settings for the Creator, State, and AutoNumber filters for wraps.
  • View = Switches between table and chart view.

Create a report link

Users with the Manage MyWraps permission can create links for custom reports using additional toolbar buttons:

  • Setup = Define the cells in the wrap to be placed in the report columns. Read more on the Setup Report help page.
  • Sort – Request the report to be sorted in a particular order. Multiple sorting levels are supported. Read more on the Setup Report page.
  • Aggregate = Request column aggregates like sum, min, max, average, stddev, absmin, absmax, rms, count, counta and countblank. These return an aggregated result at the top of one or more report columns. Read more on the Setup Report page.
  • Chart = Sets the options for the Chart view. Read more on the MyWraps charts page.
  • Chart Range = For some chart types, the data series consists of value pairs that contain high-low or start-end values that can be used to visualize ranges or duration. You use the Chart Range window to specify the two columns that contain each value pair. Read more on the MyWraps charts page.

Save the report link

MyWraps reports are not saved or re-used automatically. The next time you return to the same wrap template, you will again arrive at the unfiltered, unformatted view. When you have created a report using the tools above, you must save the full report link if you want to generate the same report again.

  • Copy – This button lets you copy the complete link containing all the parameters for the report. You can insert the link on a web page where users can request the report by clicking on its link. You can also paste the link into a MyWraps2() function call in WrapCreator. Example data is provided separately, for testing. Read more on the MyWraps functions for developers help page.

The format of a MyWraps report link is described in detail below.

MyWraps links and their parameters

The interactive part of MyWraps described above is essentially a link builder. Any MyWraps report can be saved as a single link that can be stored as a browser bookmark, added as a hyperlink on a webpage, or added to the main menu for the Wrapsite. Your Wrapsite even includes a MyWrapsGenerator Wrap that can be used to create most reports you need, in the form of MyWraps links.

Example MyWraps link

https://guide.live.excelwraps.com/MyWraps/WrapOne?Options.Creator=Any&Options.State=Live&Filter.yourname=Rachel

If we decompose a MyWraps link into its components, we find:

  • The link to the live or staged Wrapsite.
  • The path to /MyWraps/.
  • The name of the wrap template.
  • The filters Options.Creator and Options.State described above.
  • The column filter Filter.yourname sets a condition for the yourname field in the Wrap.

MyWraps link summary

This is an overview of all the possible parameters in a MyWraps link and their defaults. There is more information about specific parameters in the corresponding user interface help – to learn more about the chart parameters, read the help page about charts, etc.

Wrap (row) selection options

  • Options.Creator returns only the wraps you have created if you use Options.Creator=Me. The default is Any. Read more in the help for the Creator filter.
  • Options.State filters the wraps on their state, i.e. Live, Frozen, AwaitingSignature, or SignedByMe. The default is Any. Read more in the help for the State filter.
  • Options.AutoNumberFilter lets you filter by AutoNumber to only include the First, Last, or LastFrozen records in the report. Example: “Options.AutoNumberFilter=Last”. In interactive reports, you can use the “Filter” popup form at the top of MyWraps. Read more in the help for the AutoNumber filter.
  • Filter.<column>, e.g. Filter.yourname sets a condition for the yourname field in the Wrap. The condition is expressed as described in  Filter a list of wraps, e.g. ne%280%29 means “not equal to zero” with %28 and %29 being percent-encoded left and right parentheses. You can use filters also on columns that are not in the report, e.g. Filter.yourname also if yourname is not a visible column (it is not included in Options.Columns, read more below). Read more in the help for column filtering.
  • Options.OpenMode allows MyWraps to create Wraplinks to the source wraps for the report in enhanced ways. Select one of the following:
    • Options.OpenMode=Automatic is the default choice and will recalculate all live instances. For most reports, we recommend that you use OpenMode=Fast instead.
    • Options.OpenMode=Fast opens the wraps requested for the report without recalculation which is faster and consumes less resources than a full open.
    • Options.OpenMode=PDF directly opens the most recent PDF file saved for a wrap. This option can only be used when you provide a unique key that matches exactly one wrap. If a PDF does not exist, ExcelWraps will automatically queue a background job to generate a PDF file for the wrap. To avoid creating a PDF file, use Options.OpenMode=CheckPDF instead.
  • Options.Aggregates=Days.sum. get a sum of the values in the Days column on an extra row in the report below the column headings. There are other aggregates like min, max, average, absmin, absmax, count, counta, countblank, stddev and rms. You can only perform aggregation on the columns included in the report using Options.Columns (see below). Many aggregation types only operate on columns that have a numeric data type. Read more on the Setup Report page.

Cell (column) selection options

MyWraps only returns columns that are named and searchable.

Each cell is referred to as <field>.<datatype>.<format>, e.g. partcost.double.f2. Read more on the Setup Report help page.

  • If you don’t explicitly assign a data type to a field it is treated as a string value, e.g. left-aligned, read more in the help for data types.
  • The format specifier is only used for numeric values and defines how you want the value to be displayed in the report. For more information, study the Microsoft C# format specifiers. Examples:
    • f1 – fixed, one decimal
    • p1 – percent, one decimal

To use a different column header, i.e. have an alias name for a column, specify the field as <Column+header>(<fieldname>).<datatype>, e.g. Policy+Issue(Issue).string.

You can also use the cell coordinates from the source spreadsheet to reference a cell. The format for such a cell reference is [Column name](sheet[sheetno][cell coordinates]).datatype, e.g. Birthday(sheet2c3).date would refer to cell C3 in the second worksheet (regardless of its actual sheet name) with an alias column name of Birthday and a data type of Date. Note that the cell reference must be entirely in lowercase, e.g. “sheet2c3”.

  • Options.Columns lists the column in the order that you want them to appear in the report, using the format described above. Separate cell names with %2C which is a percentage-encoded comma.
  • Options.ColumnsEnum allows you to have the list of included cells generated automatically. Options.ColumnsEnum=Named includes all the named cells and Options.ColumnsEnum=Input includes all the input cells. These options make it easy to copy wraps using WrapStack. Options.ColumnsEnum overrides Options.Columns – if you enable ColumnsEnum then any cells which are individually requested with Options.Columns will be ignored.
  • Options.IntersectNames is used when creating a WrapStack to automatically have a database extract created with MyWraps only include the columns that are present in both the source wrap and the target wrap. The IntersectNames parameter is automatically replaced by an Options.Columns parameter that selects only the common columns.

Appearance options

  • Options.SortBy specifies the sort order for a tabular report. The format is <field>.<sortorder>, e.g. Days.Asc. Read more on the Setup Report page.
  • Options.Description=Tasks+not+on+hold defines the description of the Mywraps report.
  • Options.Title=The+Title+goes+here sets the top heading for the report.
  • Options.MaxRows limits the number of Wraps in the report. Read more on the MaxRows help page.
  • pageSize=10 causes the report to show ten wraps per page. Read more on the help page about MyWraps pagination. MaxRows is still in effect.
  • page=2 includes only the second page of wraps in the report, beginning with wrap number pageSize+1. An incorrect page setting designating a non-existent page returns an empty report, read more on the help page about MyWraps pagination.
  • OpenInstance=True is only relevant if the number of returned wraps is exactly one. With the default setting OpenInstance=False, the list of results may contain also a single wrap. If the option is set to True, and exactly one wrap is returned by the current filters, it is directly opened in edit mode. This is convenient when the filters are set to always return exactly one wrap, e.g. “today’s measurements”.

Chart options

Read more on the MyWraps charts page.

  • Options.Series is a chart option that selects the data series to appear in the chart view of the report.
  • Options.Inverted is a chart option. If the Inverted setting is true it shows a chart rotated 90 degrees, e.g. a column chart becomes a bar chart.
  • Options.Stacked is a chart option. In a stacked column chart, data series are stacked one on top of the other in vertical columns. A stacked chart can show change over time because it’s easy to compare total column or bar lengths. They also allow for part-to-whole comparisons over time, or across categories.
  • Options.Cumulative is a chart option. By adding all of the data in each of your columns and then creating a chart from the totals of each column, you can generate a cumulative chart. Cumulative charts are useful for displaying the current totals of several different series of data in one comparative visual model.

Parameter order

MyWraps attempts to group the keyword parameters in the link in a particular order for clarity. This order is predefined and cannot be changed. Links that have the parameters in a different grouping or order will still work as expected, but if the report is edited in MyWraps, the parameters will be placed in the predefined order, regardless of what order they were in initially.

  1. Options.Appends
  2. Options.Columns
  3. Options.Aggregates
  4. Options.AggregatesOnly
  5. Options.SortBy
  6. Options.State
  7. Options.Creator
  8. Options.AutoNumberFilter
  9. Options.MaxRows

Request bespoke reports

The ExcelWraps Client Services team uses powerful database reporting tools to make any report no matter how complex. These reports can be made available through your Wrapsite. Don’t hesitate to contact Client Services if you need our help.

MyWraps has limited error handling

Since MyWraps is intended for administrators, there may sometimes appear to be room for improvement of the user interface. If unexpected conditions occur, they may be presented to the developer as

Screenshot of the general "oops" message provided by MyWraps for unexpected conditions

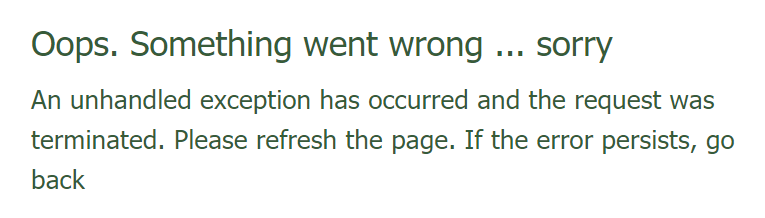
Before you contact Client Services, please make a quick pass through the data you have entered to ensure that there are no errors. As an example, entering a column filter as “gte(5)” instead of “ge(5)” for a greater-than-or-equal comparison will result in the error message above.

MyWraps settings

The pageSize setting for a Wrapsite, and the maximum value for it, are described on the MyWraps pagination help page.