MyWraps report setup

This is the help page for the Setup Report operation in MyWraps where you define a report, its columns, and any appended wraps.

Click on the Setup button in the MyWraps toolbar to initiate the creation of a new report.

Screenshot of the Setup button in MyWraps

If you don’t have this button on the toolbar, you need to ask your ExcelWraps administrator for a user role with the Manage MyWraps permission.

Character restrictions

The entire report setup can be saved as a hyperlink. Many special characters are not allowed in links, or in our internal handling of links, including

# ( ) ~ ? / & + = . %

If you use any of these characters in the wrong place in the report setup, you will get a warning message and the setting cannot be saved.

The Properties tab

Screenshot of the Properties tab for MyWraps report setup

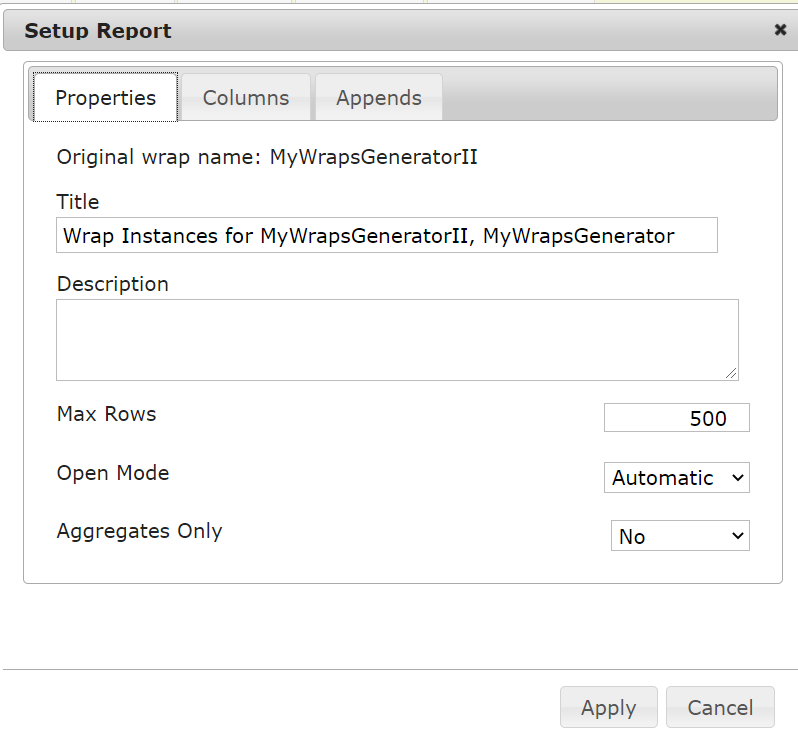
On the Properties tab, you define the following:
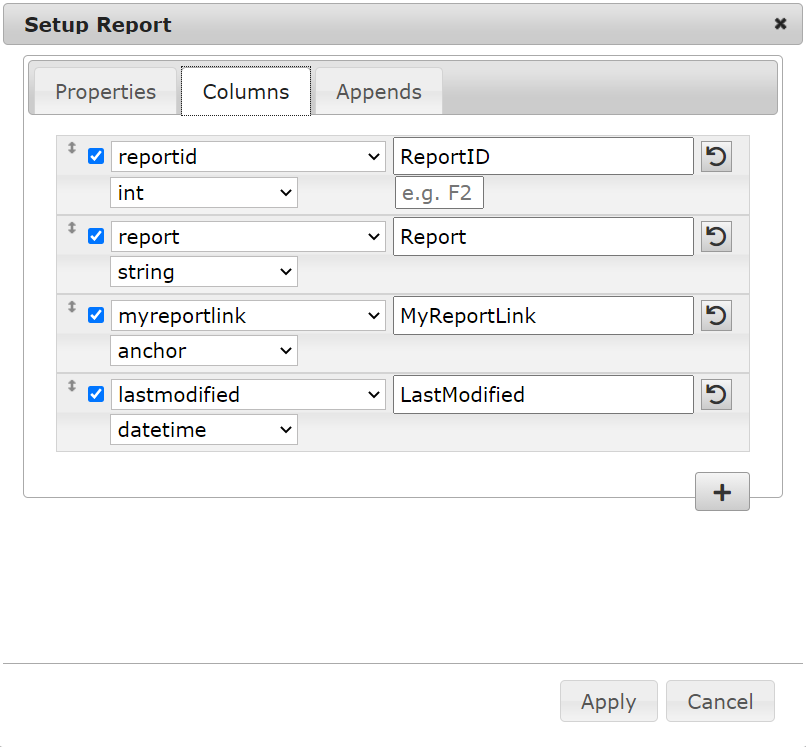
  • You assign a Title to your report, without using any of the forbidden characters described above.
  • You set a Description for the report, again without using any special characters.
  • You set Max Rows to the highest number of wraps you ever expect to have included in the report (read more about The MaxRows parameter). If a report exceeds the MaxRows limitation, there is usually something wrong with your filters or the data. You should not routinely allow this to default to 500, you should ensure that it is set with a reasonable limit for every report you create. It is there only to help you.
  • Set Open Mode to Fast when you want to use the most recently calculated data for each live wrap in the report. This speeds up access considerably. If you need to recalculate every live wrap to include the most recent data then use Automatic (read more about Openmode).
  • If Aggregates Only is set to Yes, the individual data for each wrap is not included in the report, usually making the report much shorter. The report will only contain the combined, aggregated rows for all wraps, like totals, averages, max/min values, counts, products, variances, and standard deviations.

The Columns tab

Screenshot of the Columns tab for MyWraps report setup

On the Columns tab,

  1. Add all the columns you want to include in the report using the “plus” button above the Cancel button. Select the cell name from the dropdown or just start typing the cell name and it will automatically complete it for you. This can save time when the list of cell names is very long. You can only add cells that are named and searchable to the report. If you find that one of your favorite cells is missing on the Columns tab, you can get it back by naming the cell in the wrap template, and making it searchable.
  2. Define the column headers displayed in the report using the right-hand column. You cannot use any of the restricted characters listed above in column headers.
  3. Ensure the required data type is assigned in the left-hand pop-up menu.
  4. For numeric data types, enter the appropriate format specifier in the right-hand column to say how you want the value to be displayed in the report. For more information, study the Microsoft C# format specifiers. Examples:
    • f1 – fixed, one decimal
    • p1 – percent, one decimal

Override the datatype for a column in the report

When you select the columns for a report, you can accept the original data type for a cell or select a different one. There are several uses for this:

  • A unit number can be a text value (string) ”800104” or as a number (integer) 800104. You should select the data type that best describes how you want to handle the unit number. If you define it as an integer, it is reasonable to use the aggregate function MAX to determine the maximum unit number in the column. This cannot be done if you keep the original “string” data type. Numeric values are also sorted differently than string values.
  • The datatype can also be used to select what value to be extracted from a cell holding multiple values. E.g. sig-datetime extracts the date and time for a signature cell whereas sig-date just extracts the date. sig-lastname returns the last name of the signee as a text string.

Make each row link to its source wrap

In some reports, it is useful to include a link to the source wrap from its row in the report. This enables a user to “zoom” directly from a row in the report to the wrap detail just by clicking on the provided link.

This is particularly useful when showing MyWraps reports inside wraps using the ShowTable function to display results from a MyWraps2 function call.

To do this, you just add a column with the system-generated column WrapUrl.

Screenshot of the reserved WrapUrl column generating a link to each wrap in the report

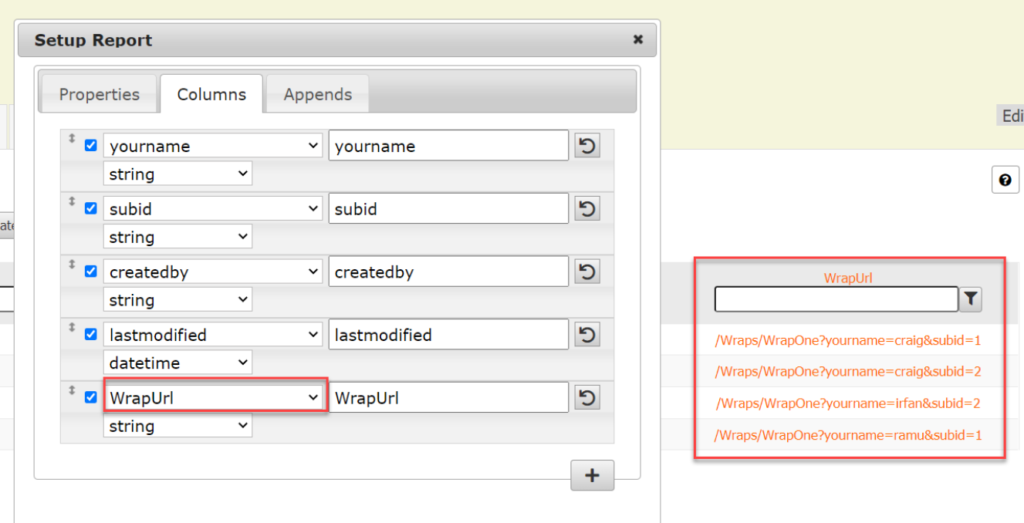
When the link is requested, it appears in a separate column in the MyWraps report, visible to the right in the screenshot above.

When used with the MyWraps2 and ShowTable functions, the WrapUrl column is displayed as an “open in new tab” icon.

Screenshot of a WrapUrl link in a table built with ShowTable

The Appends tab

Screenshot of the Append tab for MyWraps report setup

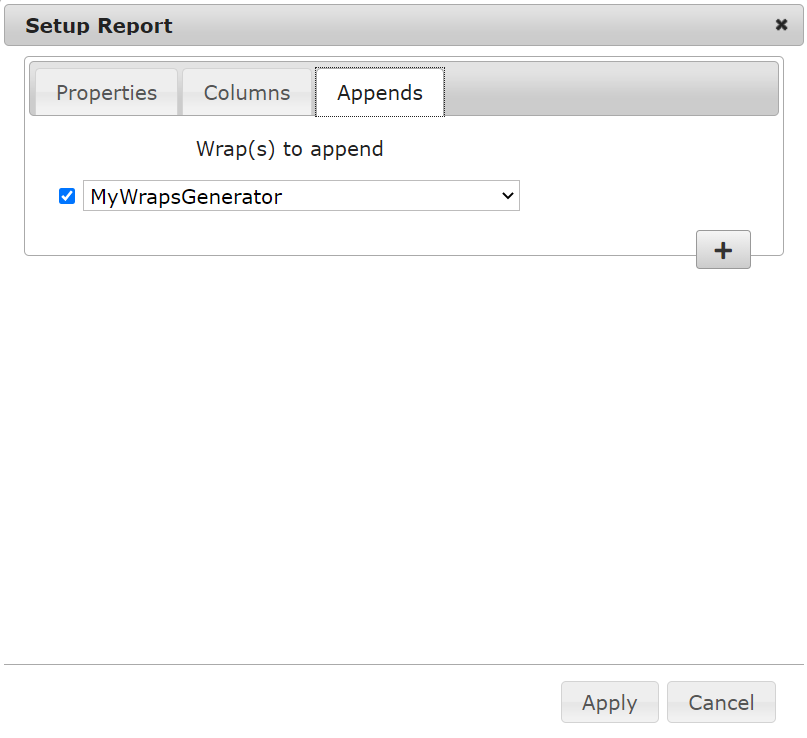
On the Appends tab, you can append other wraps to the report. As an example, if railway carriages are subject to five different inspections, each documented in its own wrap, you probably want to create a full report that shows the merged result of all five inspections, per carriage.

  1. When you define the wraps, use the same cell name for common data like car_no, depot, fails, comment etc.
  2. When you define the report, start by creating a report for the first inspection wrap.
  3. Include only the cell names/columns that are common to all the wraps in the report.
  4. When you’re happy with the report for the first inspection wrap, append the other four wraps to the same report.

Setup Data Sort

The Sort button in the MyWraps toolbar allows you to define a multi-level sort order for the report. If there is no Sort button, you may need additional permissions to create MyWraps reports, please contact your MyWraps administrator.

Select columns

Tick the checkbox for each column you want to sort on.

Select ascending/descending

For each column, select Ascending if you want the list in rising order with the lowest values first, e.g. 1 or “A”. Select Descending if you want the list in falling order with the highest value first, e.g. 9 or “Z”.

Arrange the sort order

Drag the selected columns so that the column for the primary sort order is at the top, e.g. the year, with less important columns below it, e.g. month followed by week or day.

Example

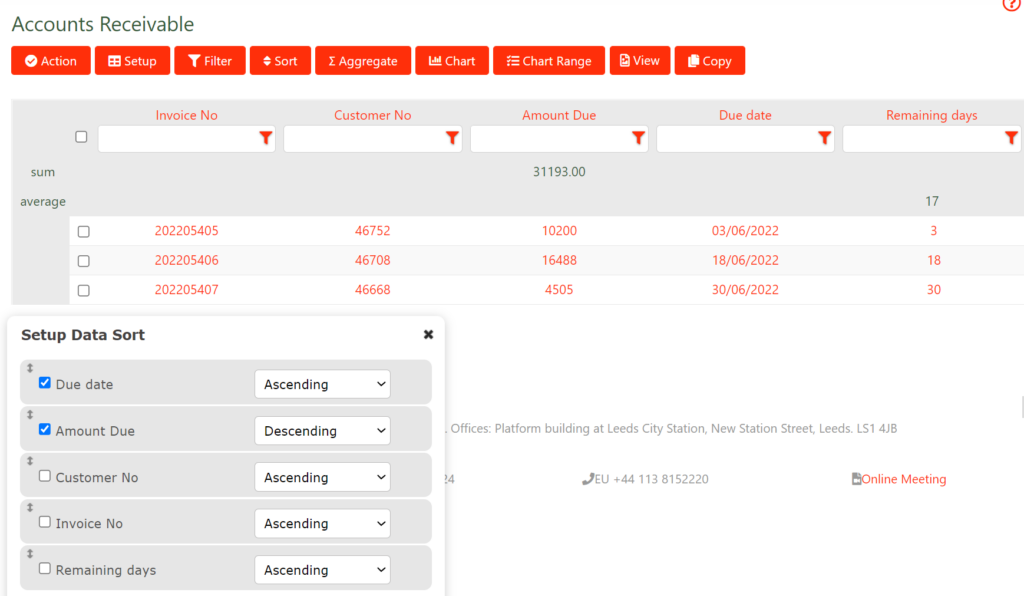
In the example below, a report is showing the accounts receivable, in with the most imminent due dates first. For each due date, the invoices with the highest amounts appear first.

Screenshot of the Sort window in MyWraps

Save the sort order

Press Apply to save the sort order. To modify the sort order later, just press Sort again.

Setup aggregation

MyWraps makes it easy to request the sum of a column, or its average value. Just press the Aggregate button in the MyWraps toolbar and define the column aggregates you want. These will return the same result as if you had used the corresponding function in Excel over the same column of the filtered wraps.

Aggregates are put at the top of the report, below the column headers. A separate row is added to the report for each aggregation type, e.g. a sum row appears when you have requested the sum of at least one column, and all the sums will appear on this row.

To add a new aggregate to the report, press Aggregate on the MyWraps toolbar. If there is no Aggregate button, you may need additional permissions to create MyWraps reports, please contact your MyWraps administrator.

If necessary, press the plus sign to the right to add a new row to the list of aggregates.

Select the column for which you want the aggregate to be calculated, and the type of aggregation you want. You can only perform aggregation on the columns defined on the Columns tab. Many aggregation types only operate on columns that have a numeric data type.

The available aggregation types are:

  • sum – all values are added together.
  • min, max – returns the lowest or highest value in any wrap in the report. If the values range from -6 to 5, min will display -6 and max will display 5.
  • average – returns the sum of the numeric values, divided by the number of numeric values. If a column contains 0, 2, 7, <text>, <blank>, <empty>, <empty>, the sum is 9, the number of numeric values is 3, and the average is 3.
  • stddev – returns the standard deviation of all the numeric values.
  • absmin/absmax – returns the lowest or highest absolute value in any wrap in the report. If the values range from -6 to 5, absmin will display 5 and absmax will display 6.
  • rms – returns the root-mean-square for all the numeric values.
  • count – returns the number of wraps in the report that have a numeric value for the column.
  • counta – returns the number of wraps in the report that have any value for the column. A cell that is unset or contains an empty string (“”) is not counted. A cell that contains blank text ” ” or a zero value 0 is also counted.
  • countblank – returns the number of wraps in the report that have no value for the column, including those that are unset or return an empty string (“”). A cell that contains blank text ” ” or a zero value 0 is not counted.

The format specifier is only used for numeric values and defines how you want the aggregated value to be displayed in the report. For more information, study the Microsoft C# format specifiers. Examples:

  • f1 – fixed, one decimal
  • p1 – percent, one decimal

Example

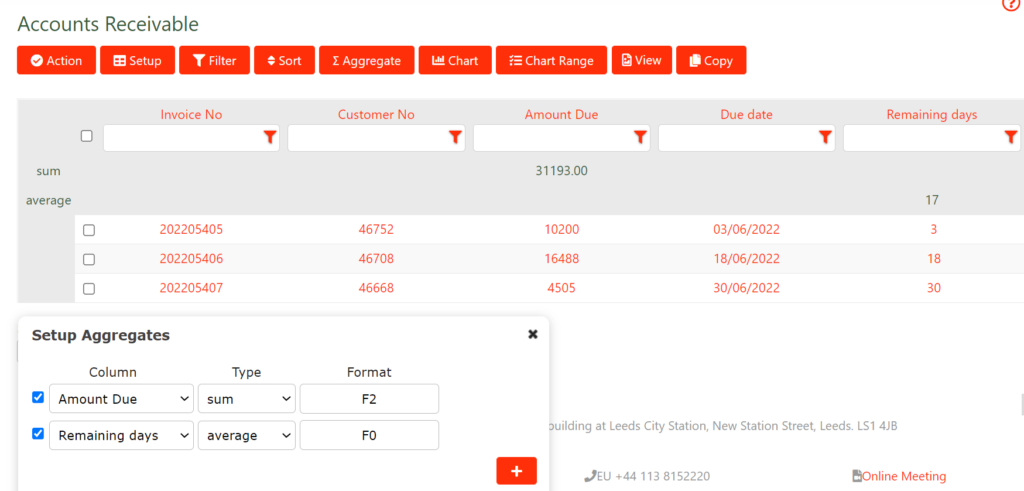
The example below is from an accounts receivable report. We have requested the sum of the Amount Due value for all outstanding invoices in the report, and the average number of Remaining days.

As you can see, MyWraps has added a sum row below the column headings. All the sums you request will appear on this row. The sum of the amount due is 31,193.00.

There is also an average row where all the requested averages will appear. The average remaining days for an invoice is 17 days.

Screenshot of a MyWraps report with sum and average aggregates