Saving KPIs automatically

ExcelWraps can regularly save periodical key performance indicators automatically. This helps you never to forget to save a KPI and they are always ready for analysis.

In many industries, process accuracy is measured using key performance indicators (KPI). Across the world, billions of measurements are saved every day:

  • Were all the expected results delivered by the process?
  • Was all the required information provided on time?
  • Was everybody involved satisfied with the results?
  • Did the process complete on time?

Once you run your processes with ExcelWraps, this kind of periodic performance ratings are easy to generate. Report data per day, week, month, or other periods can be automatically saved using a scheduling agent. Live data is updated on a regular basis so that your analysis is always based on fresh information. Historical data is securely preserved for long-term trend analysis.

Demonstration: KPI analysis at Hitachi

Screenshot of a chart showing how KPIs have changed over a year

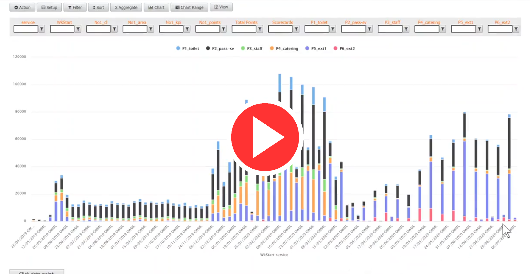
This short video demonstrates how KPIs are used for cleaning inspections of trains at Hitachi’s UK depots. Every year, tens of thousands of cleaning inspections take place. Looking at the results train by train may be interesting, but a far richer experience is had by looking at the weekly trends. Each week the top ten cleaning issues are identified, based on a points system. The cleaning faults are grouped into train areas, depot locations, and train service (Great Western and East Coast).

  • The video shows how the weekly results are presented in an Excel-like filtered list with each row showing a weekly result.
  • The chart view helps you see trends over time more clearly, e.g. what is improving and what might be becoming worse. The charts are interactive and allow you to easily zoom in on what you find interesting.
  • A “drill down” button is available on each row to open all the underlying scorecards for the week. These scorecards are ordered from highest score to lowest score so the reader automatically focuses on the most important scorecards.
  • The inspector’s comments and photos from the scorecard are presented in the table alongside the numbers.

The video is eleven minutes long. Sorry, there is no sound from 0:12 to 0:32.

The WrapMap dashboard

A dashboard of available KPIs is usually made out like a table with the dates as rows and the performance measurements as columns or vice versa. We call this a “WrapMap”.

WrapLink and WrapLinkAggregate widgets collect data from the Wrap instances that provide performance data from the process. Information is typically layered so that data from various parts of the system are aggregated in separate structures and then assembled on the WrapMap dashboard.

Information is grouped in several dimensions, e.g.

  • Per train area
  • Per depot location
  • Per train line
  • Per period (weekly, monthly, quarterly etc.)

You can zoom in or out on each dimension separately, i.e. view the performance of all the depots during a single day or study the long-time performance for a single train in a month-by-month comparison.

For the Wrap designer, a WrapMap is no different from any other Wrap in the system. It is designed as an Excel spreadsheet and uses the special ExcelWraps widgets to connect with other parts of the system to obtain the data it needs. All the condensed information on each dashboard and its underlying scorecards is also saved in the database, typically with the date as one of the Unique Keys.

As time moves on, dashboards are automatically updated with recent data from the process. A built-in scheduler creates new WrapMap instances at the beginning of each new period. At the end of the week, month, or quarter, some instances come to the end of their predefined period and become historical. All the data from the dashboard remains securely saved in the system – a treasure trove of information that is easy to analyze for trends and challenges.

The automatic update process

Once you have created the first instance of a WrapMap, you can enable automatic recalculation and new instance creation. This process has the following main steps:

  1. Automatic recalculation occurs at an interval called Frequency which is expressed in days. If the Frequency is 3, the current WrapMap instance is recalculated every three days. When triggered by the Frequency setting, the ExcelWraps server automatically starts the recalculation of the current WrapMap instance at or slightly after a designated Time, which is expressed relative to the UTC (Greenwich meridian) timezone. Recalculation starts with a refresh of all the WrapLinks and WrapLinkAggregates in the WrapMap instance. After recalculation, all the KPIs in the WrapMap instance for the current period are up-to-date. Historical KPIs are saved in frozen instances that are unaffected by recalculation.
  2. Each instance of the WrapMap covers one Period (week, month, quarter, etc.). You select the length of the period that best fits your business needs. We count the days of each period starting from an Anchor Date, which can be any date in the past that would have been day 1 of the intended cycle. At the end of each period, the current WrapMap instance is recalculated one final time and then frozen. It now holds the exact KPIs for its period and these will never change.
  3. At the beginning of a new period, a new instance of the WrapMap is created and recalculated to collect the initial KPIs for the new period.

The scheduling settings are part of the Wrap properties on the Administration dashboard > ExcelWraps > Wrap Definitions > Edit page. This is where you enable a Wrap for automatic recalculation, including creating new instances as required. Read more on the help page for Wrap administration.

Monitoring the automatic processes

You can follow the automatic processes above in the Audit trail, where all the operations above are logged. The user name associated with the data extraction scheduler is Majordomo.

Initial setup

  1. Use WrapCreator in Excel to create the Wrap that will function as the WrapMap. Define the Unique Keys for the Wrap on the Wrap tab in WrapCreator. The WrapMap must use the predefined field names year, month, and day for the period start date, and you must include these three fields in the Unique Key. If you intend to collect KPIs in multiple segments, e.g. separately per depot, line, or area, you must include also these fields in the Unique Key so that there can be one live instance of the WrapMap for each segment without a conflict for the Unique Key.
  2. WrapMap dashboards are usually made up of WrapLinks and WrapLinkAggregates that accumulate information from other Wraps. For KPIs, all the instances that are accessed are usually frozen, so you should use the openmode=fast parameter when linking to KPI sources.
  3. Upload the Wrap to your Wrapsite.
  4. Create the initial instances for the current period using the most recent start date for the period you have chosen, as described above. You may want to double-check that the date you enter into the initial instances is an even multiple of the Period length away from the Anchor Date, e.g. if the anchor date is July 1, the period is monthly, and the current date is in October, the date for all the live instances must be October 1 since this is the start date for the current monthly period. You’ll probably want to create all the live instances for which you want automatic period handling, i.e. one instance for the current period for every depot, line, area, or whatever other segment you are using. If you forget to include a segment, no error will occur, but the KPIs for the segment will not be saved. If this happens, you can just add the segment later with the same date as for the other segments, and it will be managed automatically from then on.
  5. Verify that the initial instances properly calculate the expected KPIs. The easiest way to do this is to open the instances and verify the calculated values, or by verifying the values in a MyWraps report.
  6. Activate periodic recalculation and instance creation using the scheduling settings for the Wrap Definition. This is where you set the Period, Anchor Date, Time, and Frequency for the automatic processes.
  7. At the end of the update interval set by the Frequency setting, you should see the KPIs for the current period in the live instances being automatically recalculated as described in step 1 under The Automatic Update Process above. You can verify the automatic recalculation in the Audit trail. Note that recalculation occurs at the time set by the Time option in the scheduling settings, expressed in the UTC (Greenwich Meridian) time zone.
  8. At the end of the first period, as defined by the Anchor Date and Period options in the scheduling settings, the current WrapMap instances are recalculated one final time and then frozen as described in step 2 under The Automatic Update Process above. You can verify the automatic recalculation in the Audit trail.
  9. At the beginning of the second period, as defined by the Anchor Date and Period options in the scheduling settings, a new instance of each WrapMap is created and recalculated to collect the initial KPIs for the new period as described in step 3 under The Automatic Update Process above. You can verify the new instance creation in the Audit trail.
  10. If everything is working as expected, you can now leave it to the automatic process to regularly recalculate the current instances based on the Frequency setting, and to freeze old instances and create new ones according to the Anchor Date and Period settings.

Modifying the setup

Add a segment

If you want to add another segment (e.g. depot, line or area) to the automatic process, just add a new instance and set the Unique Keys appropriately. The date must be the first date of the current period. The data extraction scheduler will automatically detect and maintain the new instance.

Remove a segment

If a depot, line or area has been closed down, there are probably no more valid KPIs to collect for it. When the first redundant instance has been created for a segment that you no longer want to maintain, you can just delete it. The data extraction scheduler will automatically detect that there is no current live instance for the segment and will just ignore it in future recalculations. The old instances that represent historic KPIs are still valid and unaffected.

Recalculate KPIs manually

If someone is asking for interim KPIs, e.g. a recalculation outside the automatic recalculation interval set by the Frequency parameter, you can just manually open the affected live WrapMap instances. This will recalculate the instances without affecting the automatic process in any way.

Freeze a wrap when its period has ended

Sometimes, a wrap with the KPIs for a previous period is not properly frozen when the period has ended. You can manually freeze historic wraps for expired periods by using the AdminFrozen column with WrapStack.