The ShowTable function formats a delimited list created by the MyWraps2 function for display as a table within a single cell.
The MyWraps2 function can conveniently fetch almost any data from your Wrapsite. If the number of returned rows is small and static, you can format the MyWraps data by separating it into separate cells, as described on the MyWraps2 help page.
In many cases, however, the extent of the returned data is unpredictable. Some trains have many cars, some have few. A static setup is not flexible enough to handle all data types. In these situations, you can use the ShowTable function to display data returned by the MyWraps2 function in a simple and flexible fashion, using only a single cell.
ShowTable supports any data source. As long as the table data is provided in a text string with row and column delimiters, it is supported by ShowTable.
ShowTable converts a delimited text string, typically provided by MyWraps2, that has row and column delimiters, to an HTML <table> structure. The table always contains all the input data – if MyWraps2 returns 23 rows of data, the table will contain 23 rows of data.
ShowTable uses only a single cell in the wrap. The width of the ShowTable cell limits the total width available to all the columns in the table. If you make the cell too narrow, the table contents may become difficult to read. You can make the cell’s column wider, or merge the cell with horizontally adjacent cells, to achieve the optimum cell width. For more information on how to use widgets efficiently, please read the Introduction to using widgets help page.
The ShowTable cell expands vertically to accommodate all the table data. This makes it easy for the user to use all the information at once. If you wish to paginate a MyWraps result, you can easily construct your own scrolling mechanism using the pageSize and page parameters in the MyWraps link, read more under Pagination below. To shorten the result by filtering the MyWraps link, read more under Filtering below.
If you need to sort the table, or select only certain cells, do this at the source, e.g. in MyWraps, so that the text string contains only the information you want to show, with the proper structure.
It is easy to link directly to each wrap using a link in the table. When you design the report, include the special WrapUrl column. The WrapUrl column is displayed as an “open in new tab” icon.

If a column contains a hyperlink, ShowTable automatically makes it clickable.
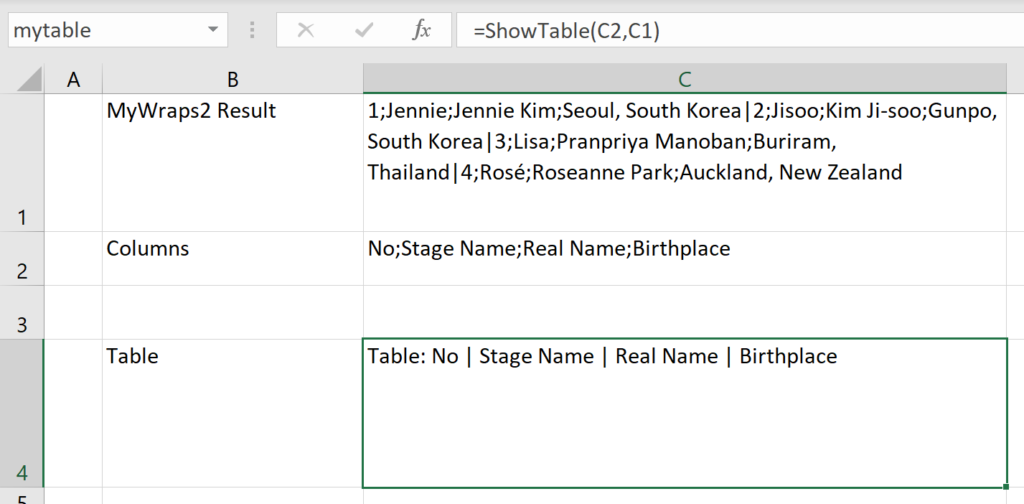
In this example, a MyWraps2 function has returned a list of members in a group in cell C1. The default delimiters are used, so rows are delimited with the “|” pipe symbol, and columns are delimited by a “;” semicolon.

The ShowTable function has two parameters, one that provides the column headers and one that points to the data from MyWraps. In the above example, the column headers have been provided in C2.
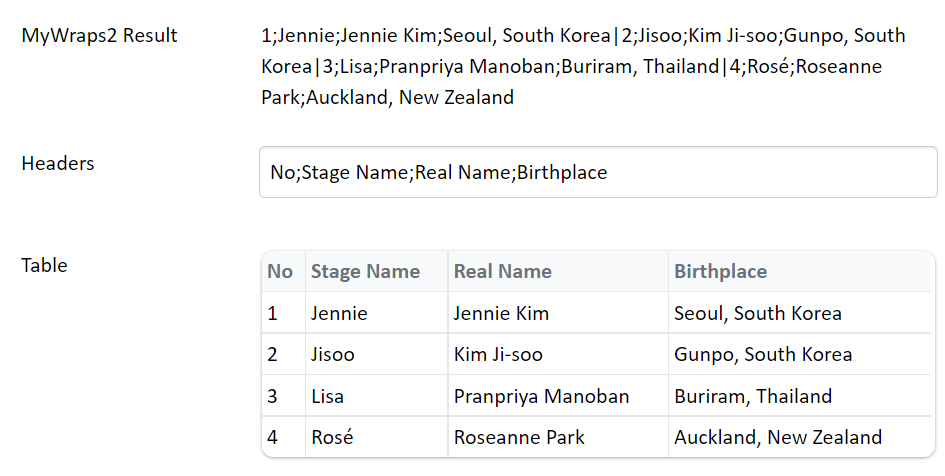
When you upload this wrap to your Wrapsite, it looks like this:

The string returned by the MyWraps2 call consists of four rows delimited by pipe characters. Each row consists of four columns delimited by semicolons. ShowTable uses the delimiters to assemble the rows and columns from MyWraps into a table. The column headers are taken from cell C2 and the table data from cell C1 as requested by the ShowTable function call.
(In the example above, we have included both the cell containing the unformatted MyWraps2 result and the cell containing the column headers for clarity. These cells would normally be on a background data sheet, and only the formatted table would be visible.)
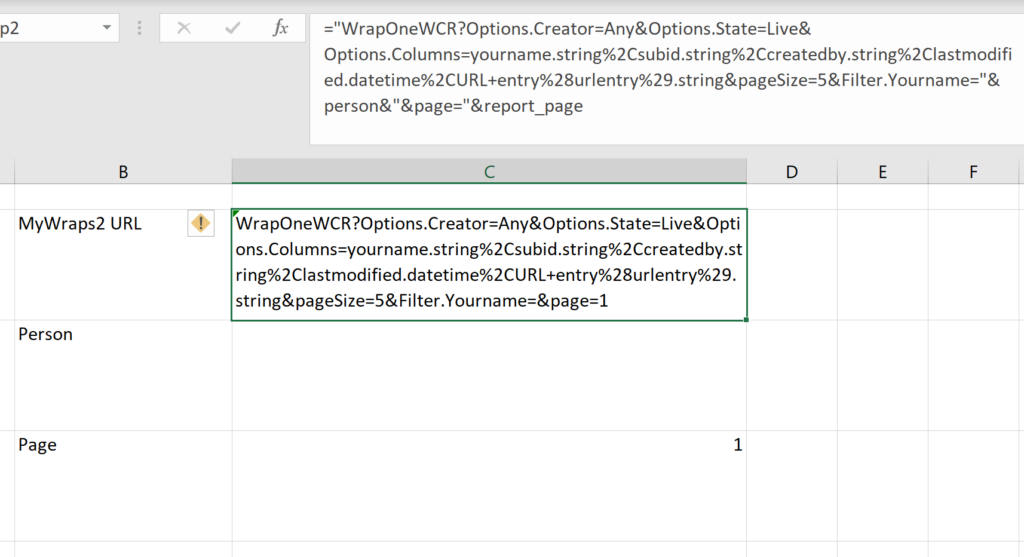
If the table you want to display is very long, scrolling through it may be inefficient. There are several simple ways to make the table shorter. Here is an example that uses both filtering and pagination.

MyWraps provides a very fast filtering mechanism. If you know a key cell in the report, you may offer the user an input field to type a value for this cell to filter on.
In the example above, we offer the user cell C4 with the caption Person. Whatever name the user enters here is placed into the MyWraps link using the
&Filter.Yourname="&person
parameter. If no name is entered, the full list is shown. If a name is entered, only the table rows for that person will appear in the table.
MyWraps also provides scrolling. You set the number of table rows per page with the pageSize parameter, in the example above we have used
&pageSize=5
You can use any number since ShowTable has no inherent limit for the number of rows in a table.
The resulting pages are referenced using the page parameter. For this, we have provided an input field in the example called report_page, so the link parameter becomes
&page="&report_page
This inserts the page number entered by the user into the MyWraps link, returning only the rows that fulfill the pagination criteria.
It may be obvious, but if you want to practice some maths, the basic pagination formula is (page-1)*pageSize+1. With pageSize=10 and page=2, the report will start with row (2-1)*10+1=11 of the table.

In the example above, a ShowTable function is used to format the data returned by a MyWraps2 function call. The function is called using this statement:
=ShowTable(C2,C1)
The first parameter designates the column headers provided in C2. The second parameter designates C1 as containing a delimited string from a MyWraps2 call.
In the wrap, the formatted table appears like this:

=ShowTable(column_headers, table_data)
Enter the cell name or cell reference for the cell containing the column headers for the table.
Enter the cell name or cell reference for the cell containing the table data from MyWraps2 as a delimited text string.