Follow these instructions to create interactive charts in Excel spreadsheets converted to Wraps with WrapCreator.
If you have a chart in your spreadsheet, WrapCreator will automatically try to create a similar chart in the converted web page. We support all the major chart types and features.
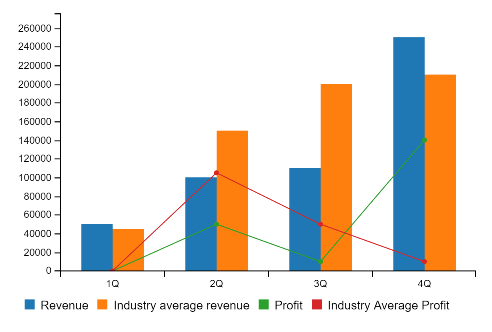
The interactive charts allow you to highlight one of the series just by hovering your mouse above its label.
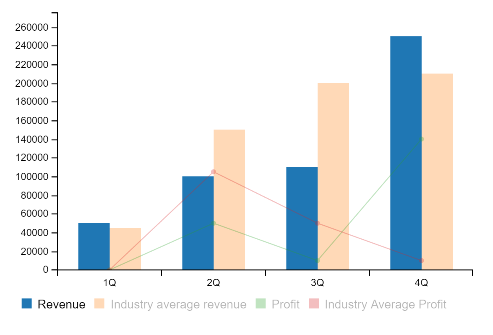
In the screenshot below, we just held the mouse pointer above the Revenue series’ label. As you can see, the other three series faded out to let you focus on the highlighted series.
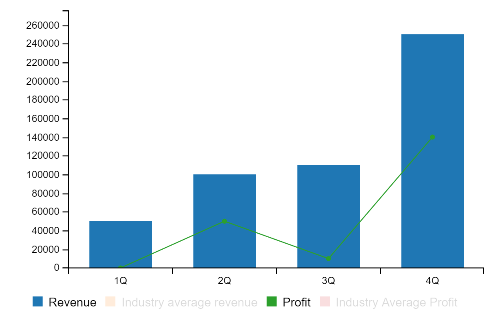
If you find some of the series distracting, just click once on the series labels and the series will be hidden. In the chart below, we simply clicked on the Industry average revenue and Industry Average Profit labels to hide them. Click on each label again to make the series visible.
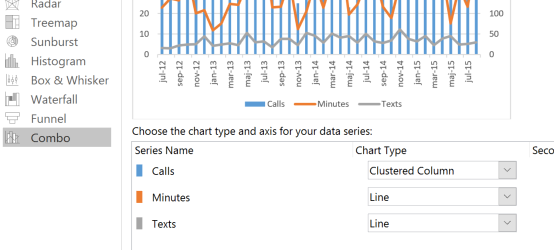
If you want to try this for yourself, create a Combo chart in Excel. In Excel 2016, it is at the bottom of the All charts tab.
You can also download our example spreadsheet just to see how charts can look in converted web pages.
Test an example of interactive charts
Download the example spreadsheet
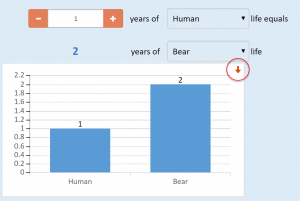
Interactive charts contain a convenient download link that allows you to save the chart as an image file.